
You probably need this if…
- Stock is spread across a DC, hubs and spokes with no single view of cover.
- Picking is paper-based and errors are found at the dock, or at the customer.
- Trucks queue because dock scheduling lives in a WhatsApp group.
- You hold too much of the wrong thing and run out of the right thing, in the same week.
- Carrier performance is a feeling rather than a number.
- Slow-moving stock sits for years because nobody owns the decision to move it.
What's already built
Modules configured
Multi-warehouse and multi-step inventory routes, barcode-driven receiving, putaway and picking, wave and batch picking with zone strategies, replenishment between locations, dock and appointment scheduling, transport with carrier rate cards, purchasing with supplier lead times, and accounting with landed cost.
Automations running
Replenishment proposals across the network, wave generation by route and cut-off, putaway rules by product characteristic and location capacity, cycle-count scheduling by ABC class, short-pick handling with substitution suggestions, carrier selection against rate and performance, and landed cost allocation to the receipt that incurred it.
AI agents
Demand forecasting per SKU and location; anomaly detection on consumption, shrinkage and lead-time drift; slow-mover and consolidation recommendations with the freed capacity and cash quantified.
Reports and documents
Days of cover by category and location, fill rate and OTIF, pick productivity by picker and zone, dock utilisation, carrier scorecards with damage and cost per drop, inventory ageing, and a stock valuation that agrees with the ledger.
The system, before we touch it
The network as it actually behaves
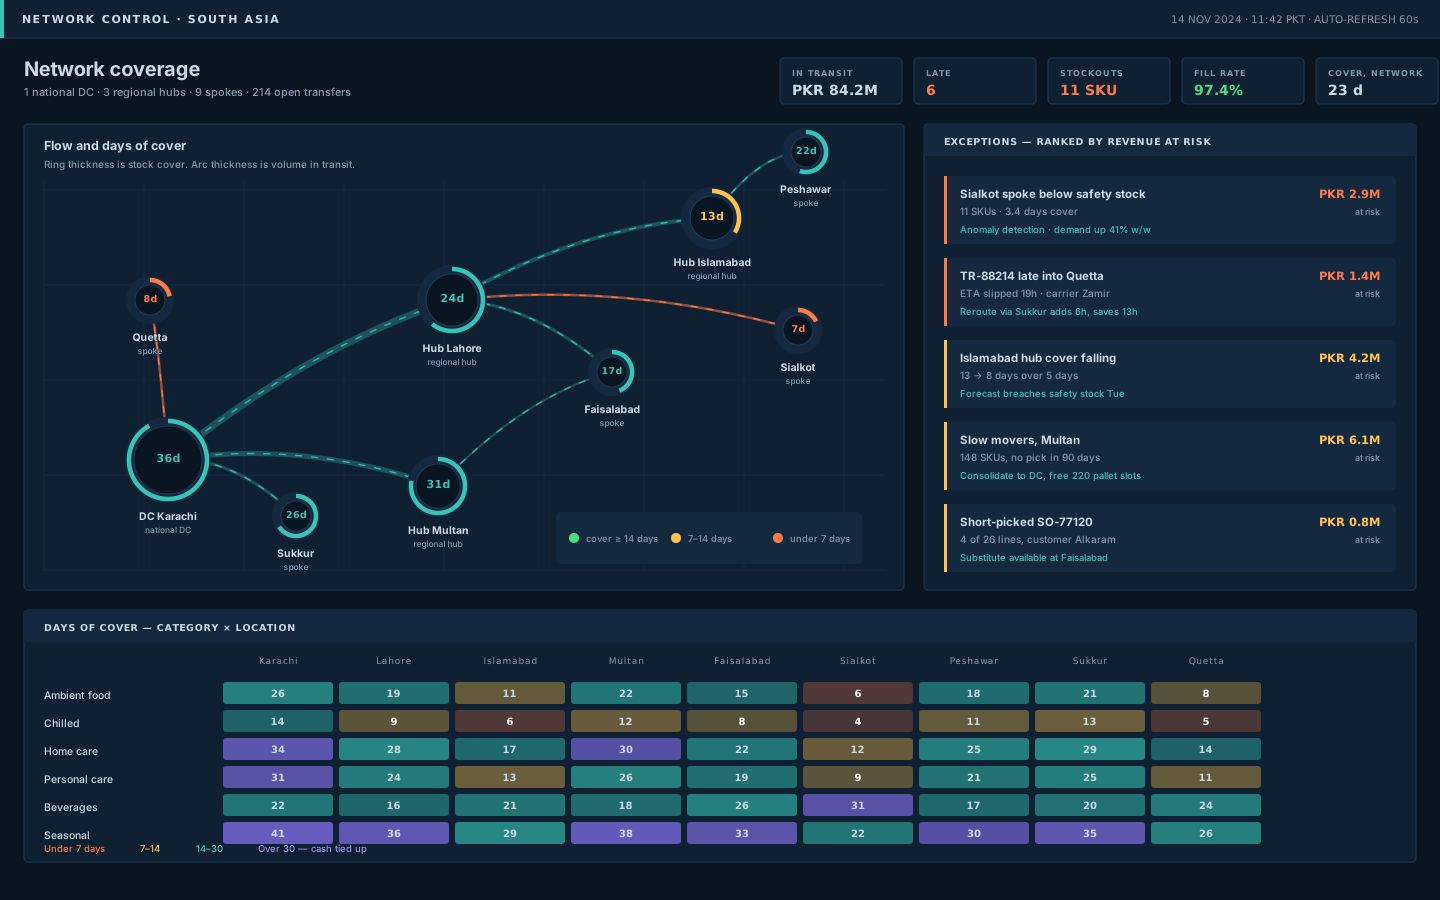
Nodes sized by role, each ring showing days of cover, arcs weighted by volume in transit with late lanes called out. The exception list on the right is ranked by revenue at risk rather than by age, and each item carries a proposed action. Underneath, days of cover as a heat grid — category against location — where the red is stockout risk and the purple is cash tied up.
Inside one DC
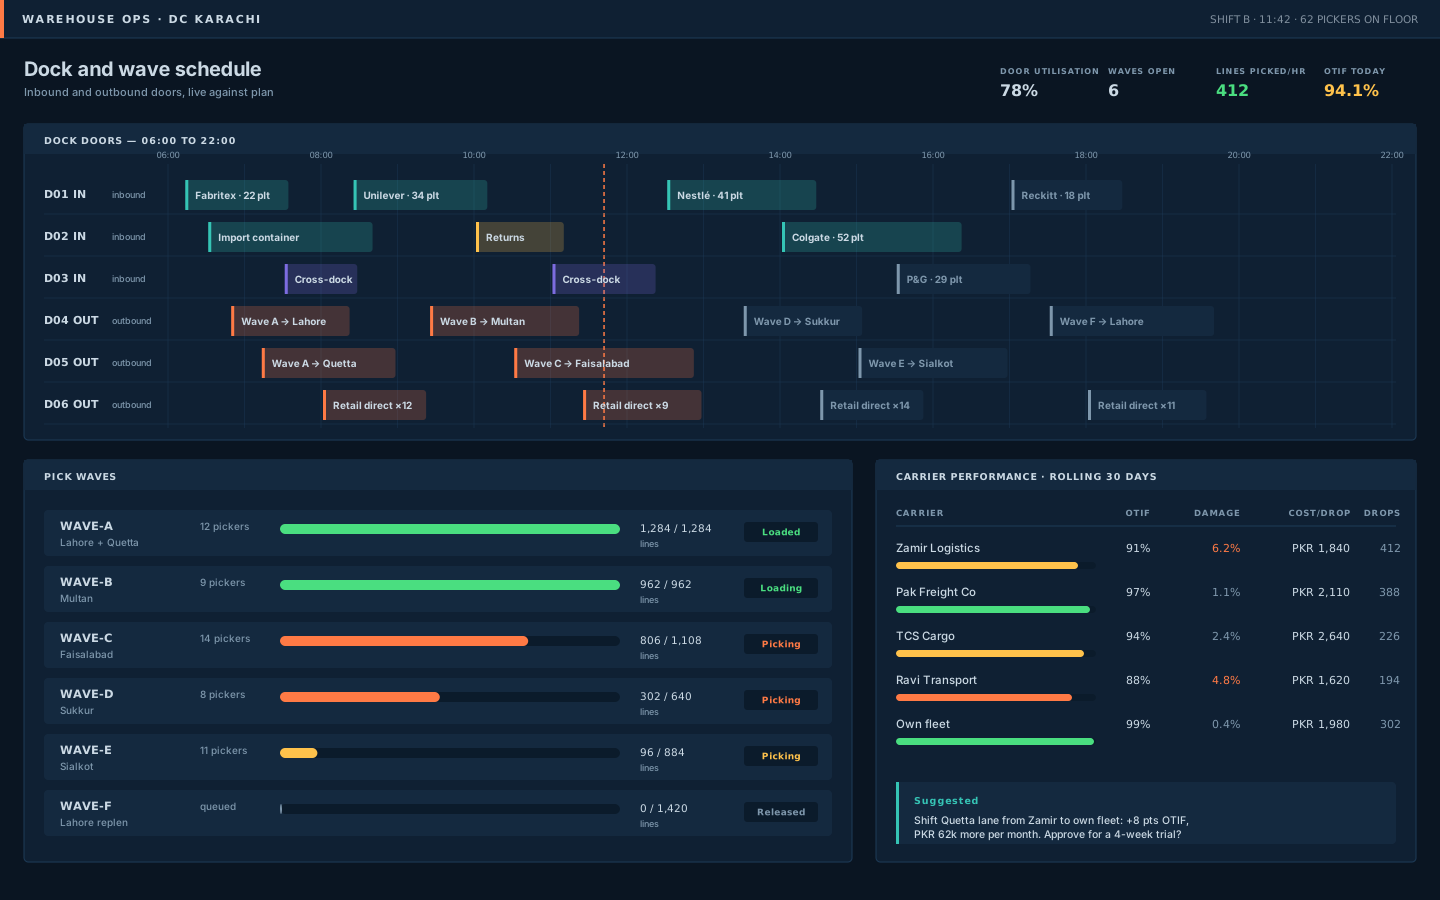
Dock doors across the day with inbound and outbound bookings, cross-dock slots marked, and a now-line. Pick waves with progress against lines, crew size and status. Carrier performance over thirty days on OTIF, damage and cost per drop — with a specific, costed suggestion at the bottom rather than a dashboard that leaves you to work it out.
Illustrative data. Your instance is configured to your entities, currency and chart of accounts.
What we tailor
Your network topology and lane structure, warehouse layout and putaway rules, wave and cut-off strategy, service levels and safety stock policy by class, carrier rate cards and allocation rules, landed cost model, and barcode hardware and label formats.
Implement wave picking in a warehouse whose locations aren't accurate. Location discipline comes first, or the waves just automate the confusion.
Weeks to live, in phases
Typical first site live in 10–14 weeks.
Connects to
What it moves
- Fill rate and OTIF
- Days of cover and inventory turns
- Pick accuracy and lines per hour
- Dock dwell time
- Cost per drop
- Shrinkage
- Value of stock older than your own threshold
We baseline each of these in the fit review so the change is provable rather than asserted.
Yours at the end of the engagement
- The production system
- Warehouse configuration and location master
- Integration code in your repository
- Hardware and floor runbooks
- The forecasting model and its assumptions
- The reporting layer
Relevant experience
Large-scale data pipeline engineering for reporting and BI, including experience from Rakuten (Japan).
DevOps and platform engineering at scale — Kubernetes, Terraform, ArgoCD, Datadog, AWS and GCP — led at Love, Bonito (Singapore) and consulted for Chalhoub Group (UAE).
Multi-entity Odoo operations covering purchasing, inventory and accounting for a telecoms group across eleven companies.
Common questions
Do we need RFID?
Rarely. Barcode gets most warehouses most of the way, and RFID earns its cost only in specific patterns — high-value serialised goods, or very high pick density. We'll model both during the fit review rather than assume.
Can this run alongside a 3PL?
Yes. The 3PL becomes a location in the network with its own cover and its own service level, integrated by file or API. You get one view whether the pallet is yours or theirs.
How good is the forecast really?
Good on stable, high-volume SKUs; weak on new products and one-off promotions, where it says so rather than guessing. We publish forecast accuracy per class so you know which numbers to trust.
We have a WMS already. Is this a replacement?
Not necessarily. If your WMS works, the network, replenishment and finance layers integrate to it. The audit tells you whether replacing it is cheaper than keeping it.